A quick look at presidential approval ratings
At NEIFI, we’re apolitical. Though we do enjoy data analysis. And as such, inspired by the widespread attention currently being given to President Trump’s approval rating (much of that attention being drawn by the president himself), we decided to take a look at historical presidential approval rating data (available from 1941-present at http://www.presidency.ucsb.edu/data/popularity.php) . After collecting the data, we quickly observed some general trends:
For one, the presidents of yesteryear were substantially more popular than the more recent presidents. Here are the average monthly approval ratings shown in terms of approval +/- (i.e. the percentage approving, minus the percentage who disapprove, averaged over all calendar months in which a president was in office; thus an approval +/- of +20 reads as “20% more voters approved than disapproved over the life of the presidency”) for all presidents for whom data is available, in chronological order:
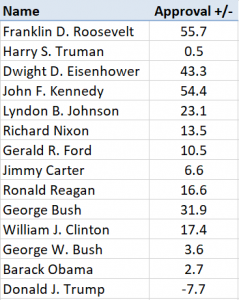
There are of course ups and downs, but overall, the clear trend is that Americans have grown far more contentious over their presidents than was formerly the case. The stratospheric approval ratings of Roosevelt, Eisenhower and Kennedy are particularly remarkable; also illustrative is the difference between the last two two-term presidents of the 20th century, Reagan and Clinton (both of whom averaged +17 approval), with the two long-serving presidents of the 21st century, Bush and Obama (both of whom averaged around +3).
Second: there is a very clear “honeymoon effect”; presidents are never more popular than at the beginning of their term, and they go downhill fast. Things more or less flatten out by a president’s fourth year in office, but the first three years are brutal. Here is the change in approval +/- from month 1 (the month in which a president takes office) to month 37 (three years later), for all presidents for whom data from those months are available, except for those who took office under exceptional circumstances which could have affected their initial approval ratings (Truman, Johnson, Ford):
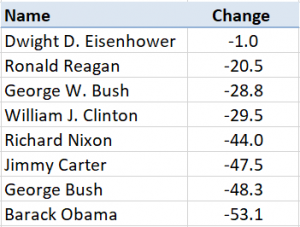

The average: -34.1. Meaning that the average president loses almost a full point of approval +/- per month during his first three years in office. Naturally, the decline isn’t linear; of that 34-point drop, roughly 18 points fall off in year 1, 12 in year 2, and 4 in year 3.
***
Adjusted Approval Ratings: Favorability Above Average (FAA)
In order to fairly compare presidents in different eras at different points in their presidencies, then, we need to adjust for context. In other words, if we want to know whether Trump’s -11 approval rating so far in February 2017 is more or less impressive than, say, Jimmy Carter’s -29 in June 1979, we need to adjust those numbers to reflect the fact that a) presidential approval ratings have generally gone downhill over time, meaning that all else being equal, we’d expect Carter’s raw numbers to be higher than Trump’s, and b) the fact that February 2017 is at the beginning of Trump’s term, whereas June 1979 was shortly after the midpoint of Carter’s term. (For simplicity’s sake, we assume here that the “true talent level” of presidents has remained constant over time; this may or may not be true, but in any case, it’s not a question that can be answered by means of approval ratings).
After making the necessary corrections, we then scaled the resulting figures such that the average monthly approval rating comes out at 0, giving us a metric of Favorability Above Average (FAA). Here, then, is the final leaderboard, the average monthly FAA score for each of the past 14 presidents:
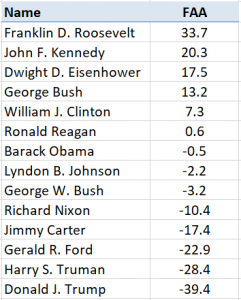

So, yes, it appears President Trump is truly in uncharted territory. Based on historical trends, he ought to be sitting around +31 this month (i.e. something like 63% approve, 32% disapprove, 5% undecided); instead, his February average currently sits at -11, and is trending downward. No other president for whom we have approval rating data has started anywhere near this level.
Could President Trump regain favorability? It’s hard to say. There are numerous precedents for dramatic declines in approval rating: Truman, for instance, fell from a ludicrous+80 average approval during his first six months in office to a low of -43 in January 1952. George H.W. Bush averaged +62 from January-June 1991, but fell to -19 from May-October 1992 (and lost re-election). Sustained improvements, however, especially during a president’s first term, are much rarer. The only encouraging example for Trump is President Clinton, who endured a six-month period (July-December 1994) in which he averaged a mere -7, but recovered to average a +19 in the six months leading up to his re-election.